Personal Project · March 2026
London Cherry
Blossom Map
Personal
HTML · Leaflet.js
Open data
Vibe coding
Mar 2026
A map tracking cherry blossom bloom locations and timing across London — built in response to climate change making traditional bloom timing unpredictable. Started with a single vibe-coded prompt and iterated based on real-world manual testing.
View project→
Artifact 01 — Problem framing
The Problem
Cherry blossom season in London is one of the most searched-for seasonal events — but existing resources were static, inaccurate, or required knowing where to look. Climate change has shifted bloom timing year by year, making forecasts based on historical averages unreliable. The only reliable source was social media in real time.
Existing solution
Marked Google Maps
The best public resource was a crowd-edited Google Map with static pins. No bloom status, no timing, no way to know if a location had already peaked or not yet bloomed.
Reference model
Japan Meteorological Corporation Forecast
Japan's cherry blossom forecasting model — released annually by JMC — served as a conceptual reference for how bloom prediction could work, combining temperature data with species-specific bloom models.
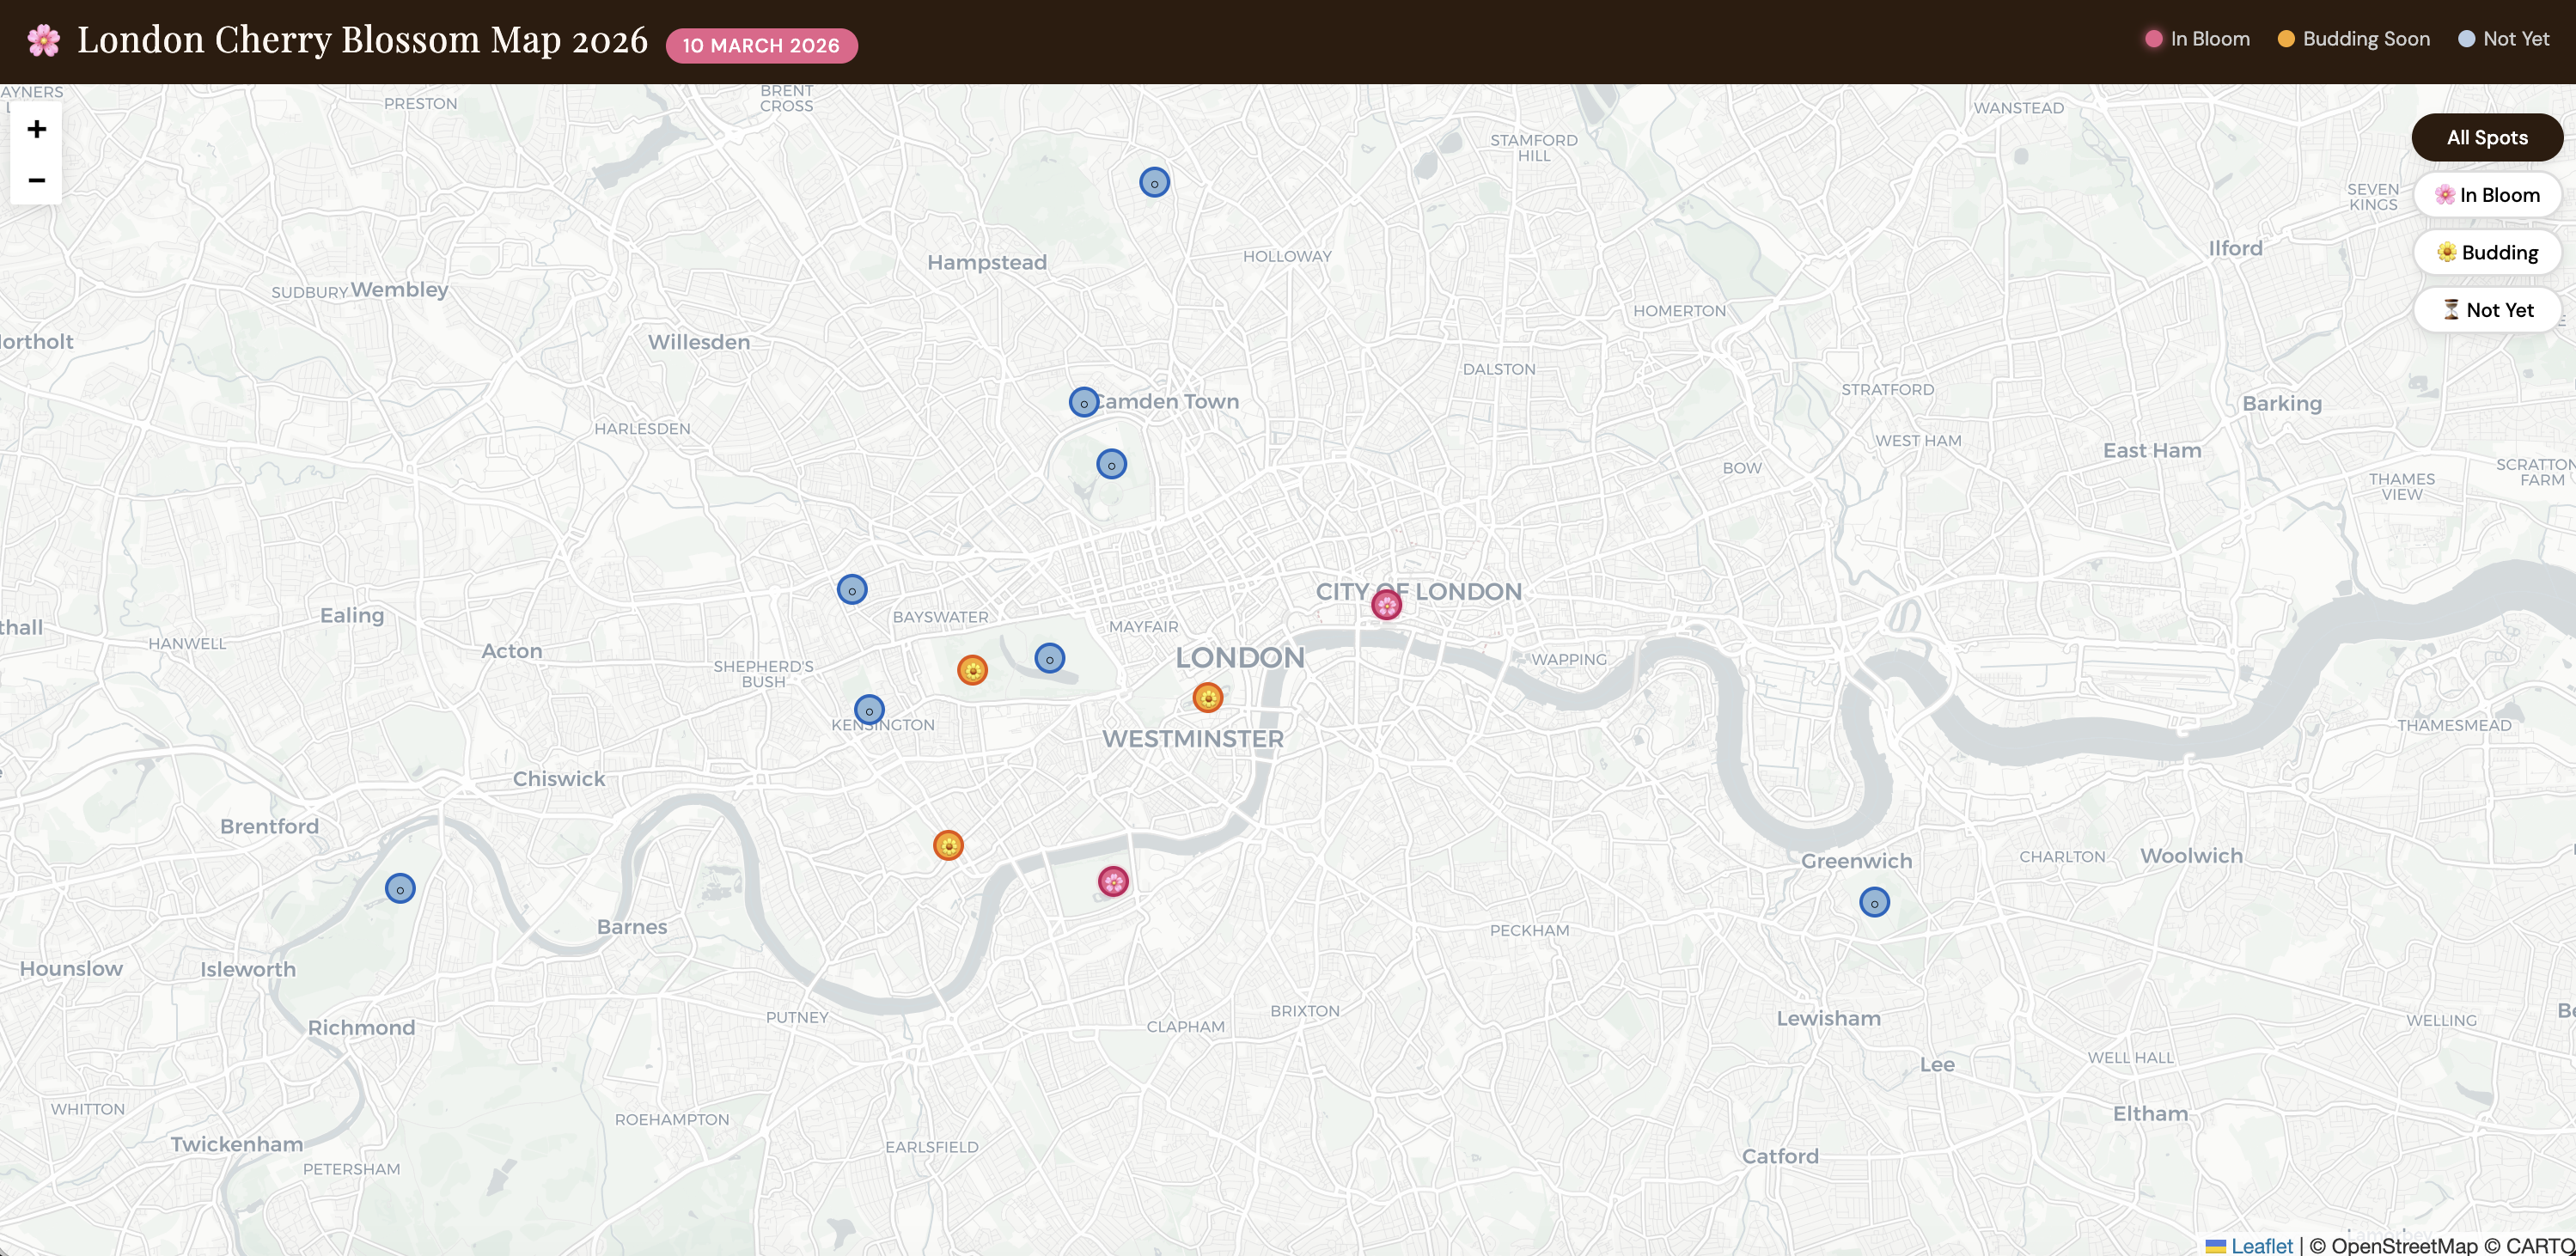
Fig 1. Existing resources — static pins, no bloom status, no timing information
Artifact 02 — Methodology
Process
A fast iterative process — from a single vibe-coded prompt through to manual real-world accuracy testing and a second iteration incorporating new locations and bloom status updates.
01
Problem framing
Identified gap between what people needed (real-time bloom status) and what existed (static pins)
02
Vibe coding
Single prompt: "create a map showing cherry blossom locations in London and timing"
03
Manual testing
Cross-checked map against Instagram — Kew Gardens, #CherryBlossomLondon, influencer stories
04
Iteration
Added unlisted locations (Swiss Cottage), improved accuracy, refined bloom status labels
05
Future scope
Mapped out API needs, user interaction model, and database design for next year's forecast

Fig 2. Iteration 1 — initial map output from the first vibe-coded prompt
Artifact 03 — Iterations
Iteration Log
Two main iterations, each driven by a specific question about accuracy or completeness — not by assumptions.
Iteration 1 — Mar 2026
First working map
Generated from a single prompt. Showed location pins and rough timing labels. Looked reasonable — but how accurate was it?
- Checked Kew Gardens Instagram for live bloom updates
- Cross-referenced #CherryBlossomLondon hashtag
- Monitored influencer stories for real-time status
Iteration 2 — Mar 2026
Accuracy & new locations
Manual testing revealed Battersea Park was blooming. Swiss Cottage — an unlisted spot — was also blooming. Neither appeared in the first version.
- Added Battersea Park with accurate bloom status
- Added Swiss Cottage as a newly discovered location
- Raised question: how to enable real-time data updates?
Artifact 04 — Insights
Key Learnings
What the process surfaced — about the problem, the tool, and what a real solution would need.
01
Social media is the most accurate real-time data source
Instagram and hashtag tracking outperformed any static dataset for current bloom status. A real solution needs a social listening or community-submission layer.
02
Unlisted locations are a significant gap
Swiss Cottage was actively blooming but absent from every existing map. User-submitted locations would be essential for full coverage.
03
Vibe coding is fast for prototyping, not for accuracy
The first prompt produced a visually usable map in minutes — but manual validation was still essential. Speed of generation ≠ accuracy of data.
04
The interesting problem is forecasting, not mapping
Showing current bloom status is useful. Predicting next week's peak bloom locations — using temperature data and species models — would be genuinely novel for London.
Artifact 05 — Next steps
Future Iterations
The questions this project opened up — mapped to concrete next steps.
User interaction model
What interactions do users need? Report a bloom, save a location, get notified when a park peaks? Need to define the core user task before building any UI.
Real-time data API
Which API can provide live or near-live bloom status data? Options include weather APIs (for temperature-based prediction), iNaturalist (citizen science observations), or a community submission model.
Bloom database — building from this year onwards
Collect bloom dates, locations, and peak timing this season to start building a London-specific dataset. Next year's forecast depends on this year's data.
Forecasting model
Use accumulated bloom data + temperature records to build a species-specific bloom prediction model for London, similar to Japan Meteorological Corporation's sakura forecast.
Deployment
Consider deployment options — GitHub Pages for a static version, or a lightweight backend if real-time community submissions are added.